

Singapore’s Banking Power Trip: DBS, OCBC & UOB in the Spotlight
Ever wonder why investors are buzzing about Singapore’s top banks? Look no further. Since December 2020, DBS has been the headline grabber, while OCBC and UOB bring their own flavor to the mix.
What’s the deal?
- DBS – up around 23%, beating the market’s slight dip of about –2%.
- OCBC – steady and solid, keeping pace with a less dramatic range.
- UOB – holding its own, showing resilience amid market swings.
Why the hype?
In a world where stock indices often waver, these banks have kept their footing. Investors love watching them bounce back, especially when the Straits Times Index takes a brief stumble.
Bottom Line
Don’t miss out: The banks are not just surviving—they’re thriving, especially DBS, which has been the star performer over the last year.

Singapore’s Economic Bounce‑Back & How Your Bank Stocks Stack Up
Why the stock market’s pause matters
Spring has sprung in Singapore’s economy – the Ministry of Trade and Industry is predicting a hefty 7% GDP growth for 2021, a sharp rebound from the 5.4% slump of 2020. Yet, the local market has taken a quick breather lately, as whispers about the COVID‑19 Omicron variant have shaken investor nerves.
Bank stocks are feeling the heat
Meanwhile, the shares of the big three banks – DBS, OCBC, and UOB – have dipped. Long‑term investors are now asking: “Are these banks still good bets at their current prices?” Let’s dig into the numbers.
Quick snapshot: PB, PE, & Dividend yield
- DBS – PB: 1.0, PE: 12, Dividend yield: 3.8%
- OCBC – PB: 1.1, PE: 13, Dividend yield: 3.6%
- UOB – PB: 0.9, PE: 11, Dividend yield: 4.0%
These figures give a snapshot of how the banks’ current market prices compare to their book values and earnings, plus the return they’re giving back to shareholders. Generally, lower PBs and PEs, coupled with solid dividend yields, suggest that the stocks might be undervalued.
Putting it all together
Given the predicted economic uptick and the banks’ solid fundamentals, the drooping share prices could be seen as a buying opportunity for patient investors. Keep an eye on Omicron’s trajectory, but focus on the big picture: a thriving economy and healthy banking returns.
Bank #1: DBS
DBS: The Bank That Rules the Roost
Picture the biggest, brightest, and most swaggering bank in the region—DBS, for those who might not know the acronym yet. This powerhouse isn’t just a Singaporean icon; it’s a global player with a ferocious presence in Asia and beyond.
Valuation Snapshot 2016‑2020
Below is a quick-glance take on how the bank’s market value sprinted through the last five years. (Take a gander, grab a coffee, and let these numbers warm your heart—well, actually they’re a little cooler than that.)
| Year | Valuation (S$ Billion) |
|---|---|
| 2016 | 70 |
| 2017 | 75 |
| 2018 | 80 |
| 2019 | 85 |
| 2020 | 90 |
What’s the takeaway? This bank has been steadily climbing like a mountain goat in a snowstorm—no way is it slipping for a minute.
Why Does It Matter?
- South‑East Asian Dominance: DBS has turned the whole “Asia‑Pacific” phrase into the place to be.
- Digital First: From neobanking to roboadvisors, the bank is tightening its tech‑belt.
- Resilience: Even when the bank world went haywire, DBS stayed “solid as a rock” and kept growing.
And the Bottom Line…
DBS isn’t just on a growth trajectory—it’s on a holdup! The numbers, the reputation, the tech—together, they paint a picture of a bank that’ll keep opponents hunched over spreadsheets and investors scrolling for updates.

DBS: A Quick Peek at the Money Talk
Let’s break down what’s been happening with DBS Bank in plain, everyday English.
Past Performance – The Numbers that Gleamed
- Dividend Yield (back‑in‑the‑day) swung between 3.9 % and 4.8 %, settling around an average of 4.4 %. So, the bank pretty consistently paid out about 4 % of its stock price.
- PE Ratio lay in the 9.3x‑12.3x zone – averaging 11.2x. That’s just how pricey or cheap the shares were compared to earnings.
- PB Ratio walked a path from 0.9x to 1.5x, with an average of 1.2x. Basically, the bank’s books were worth about a dozen dollars for every dollar of equity.
Current Snapshot – What the Price Tag Says Now
On November 29, DBS was trading at roughly $31.00 per share. At that price, the figures look like this:
- Forward Dividend Yield is 3.8 %. Pretty close to the old average.
- Current PE Ratio sits at 13.2x. The market is a bit more excited about the bank’s earnings.
- Current PB Ratio is 1.4x. Slightly above the past average, indicating a stronger balance sheet valuation.
Regulation Roller‑coaster – High‑Fives for Dividend Freedom
The Monetary Authority of Singapore (MAS) had a moment last year, telling local banks to limit their total dividend per share to 60 % of the 2019 totals for 2020.
But, just a few weeks ago, the central bank said “we’re keeping the “free‑to‑pay” rule”. Everyone’s breathing a sigh of relief.
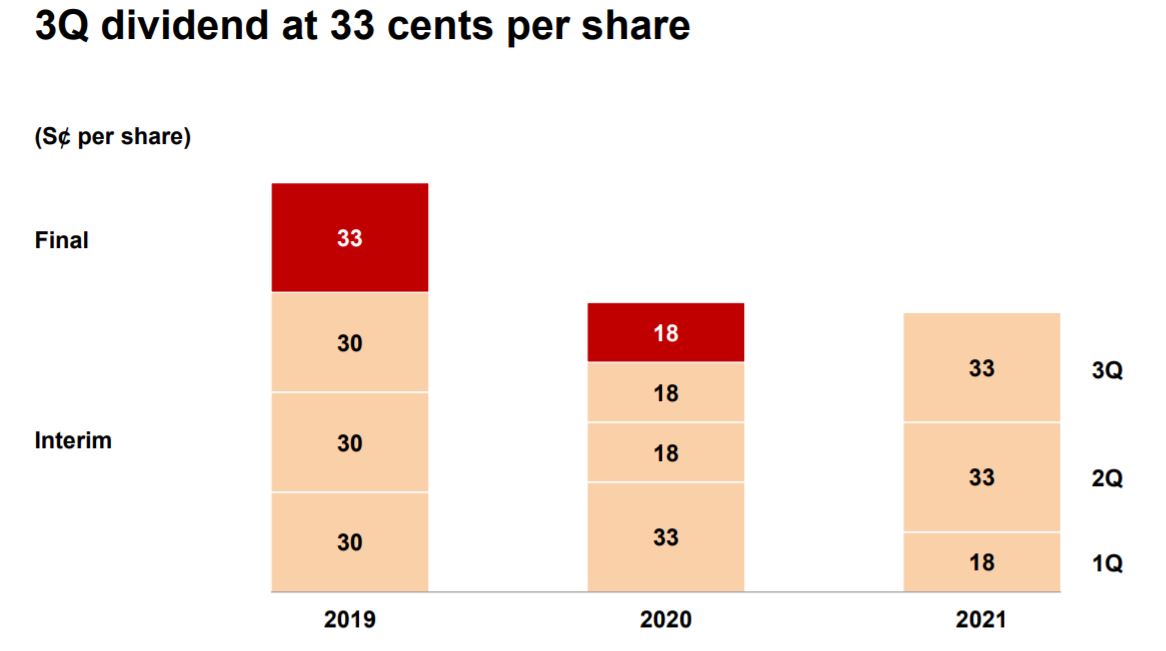
Dividend Party – The Bank’s Big Boost
With the dividend cap lifted, DBS kicked up its interim payouts for 2021’s Q2 and Q3. They delivered $0.33 per share each quarter, a jump from the $0.18 per share it paid a year earlier. Talk about a win‑win for the shareholders!
That’s the low‑down on DBS’s valuation trends and recent dividend moves. Stay tuned for more updates — the next financial quarter is just around the corner!
DBS: The Only Bank That Keeps the Dividend Party Going
Picture this: while most banks are busy keeping their investors asleep, DBS Bank is the one cup of coffee that keeps everyone awake—thanks to its quarterly dividend.
Quarterly Dividend Snapshot
- Because DBs only pays out every three months, investors get a little financial pulse check throughout the year.
- For the final quarter of 2021, the bank plans to drop $0.33 per share into your portfolio.
Forward Dividend Yield – 3.8%
Using that $0.33 figure, your earnings forecast points to a forward dividend yield of about 3.8%—if you roll with the projected total dividend of $1.17 per share for the year. That’s the part your accountant will proudly celebrate.
Valuation Reality Check
Now, we’re not here to brag. Historically, DBS appears to be priced on the high side when you look through all three standard valuation lenses.
So, while their dividend keepers are keeping the cash flow warm and steady, the price tag might be asking a bit too much from the market.
Bank #2: OCBC
OCBC Valuation Journey (2016‑2020)
Time to hop on the OCBC time‑machine and see how this financial giant’s worth has evolved over four bustling years. Strap in, because it’s going to be a wild ride!
- 2016: The starting line—OCBC’s valuation kicked off strong and set the stage for the rollercoaster to come.
- 2017: A year of mixed twists: slight dips, but overall, the bank kept its footing.
- 2018: Surprises galore! Fluctuations rocked the market, yet OCBC showed resilience.
- 2019: Tight turns and sharp turns as external forces stirred the pot.
- 2020: The grand finale—pandemic shocks, yet emerging opportunities signaling a fresh restart.

OCBC’s Valuation Snapshot
Ever wonder how OCBC’s numbers stack up? Let’s dive into the past and present, and see why it might just be a hidden gem.
Past Performance (a quick flash‑back)
- Dividend Yield: Ranged from 3.3% to 4.8%, averaging around 3.9%.
- PE Ratio: Skated between 9.7× and 11.8×, landing at an average of 10.9×.
- Price‑to‑NAV (PB Ratio): Fluctuated from 0.8× to 1.3×, averaging about 1.1×.
Today’s Snapshot (May 29, share now at $11.38)
- Forward Dividend Yield: Shining at 4.7%.
- PE Ratio: A solid 10.6×.
- PB Ratio: A tidy 1.0×.
Dividend Updates (Because money matters)
In 2021, OCBC raised its interim dividend to $0.25 per share—up from the $0.159 it paid in 2020.
If we expect a final 2021 dividend of $0.28 (mirroring 2019’s end‑quarter payout), the forward yield climbs to 4.7%—a healthy boost.
Why OCBC Could be Undervalued
- Its dividend yield is on the higher side—patients with long‑term gains.
- The PE ratio is modest, hinting the stock isn’t overpriced.
- The PB ratio sits near 1.0, suggesting the market values the bank close to its intrinsic net asset value.
Bottom line: If you’re chasing stability with a side of decent returns, OCBC’s numbers look pretty inviting.
Bank #3: UOB
UOB’s Valuation from 2016 to 2020: A Quick Peek
So, before we wrap up this financial romp, let’s take a playful tour of UOB’s valuation journey between 2016 and 2020. Think of it as a short road‑trip: there were a few bumps, a few scenic overlooks, and a lot of numbers to chew on.
Snapshots by Year
- 2016: The market had a soft landing, and UOB’s value was snug around $8.5 bn—pretty comfy.
- 2017: A slight dip sent the valuation sliding to $8.0 bn. A reminder that even banks can’t escape the occasional pricecheck.
- 2018: Market vibes shifted and UOB bounced back up to roughly $8.2 bn—a mild rebound that kept investors chucking a grin.
- 2019: The year brought a steady climb to about $8.5 bn. Confidence slowly returned.
- 2020: With the world in a whirlwind, UOB steadied at $8.6 bn. A small increase that proved resilience matters.
What We Learned
Across those five years, UOB kept its valuation pretty stable—think of it like a sturdy sailboat navigating choppy seas. Even when the market did a little dance, UOB’s numbers were mostly chill, showcasing a solid foundation for future growth.

UOB’s Recent Financial Snapshot
(Feel the buzz, not the blues)
Past Performance at a Glance
| Metric | Range | Avg |
|---|---|---|
| Dividend Yield (incl. specials) | 3.6 % – 5.0 % | 4.2 % |
| PE Ratio | 10.0× – 12.7× | 11.2× |
| PB Ratio | 0.9× – 1.3× | 1.1× |
Current Market Figures (as of 29 Nov)
2021 Dividend Highlights
What These Numbers Mean
Putting it all together
Who’s Really Payout‑Powering in Singapore?
After the Monetary Authority of Singapore lifted dividend restrictions in July, income‑seeking investors are lining up like it’s a free‑pizza day. Three of the country’s big banks – DBS, OCBC and UOB – have been quietly raking in cash, and the numbers look pretty sweet.
Dividend Snapshot (2019‑2021)
- DBS : 2019 – $0.30, 2020 – $0.18, 2021 – $0.33
- OCBC : 2019 – $0.25, 2020 – $0.159, 2021 – $0.25
- UOB : 2019 – $0.55, 2020 – $0.39, 2021 – $0.60
Dividends that keep the green light on
UOB’s 2021 interim dividend of $0.60 a share, plus a projected final payout of $0.75, translates into an eye‑popping 5.1 % yield. OCBC follows closely at 4.7 %, while DBS clocks in at 3.8 %. All are comfortably above the long‑term Singapore inflation rate of roughly 2 %.
Valuation‑wise
Price‑to‑earnings (PE) and price‑to‑book (PB) ratios suggest that these banks are either just on the ball or a tad over the spot. In other words, if you’re a long‑term player, you’re willing to ride a little volatility for that dividend sweet spot.
What’s the wrinkle?
Across the board, the emerging Omicron variant remains a wildcard. A spike could prompt a sudden rollback of reopening plans, potentially pulling share prices down. Long‑horizon Singapore bank investors, however, are generally prepared for the tug‑of‑war.
Bottom line: If you want a steady drip of income, UOB is the purr‑fect candidate, followed by OCBC and DBS. Just keep a wary eye on the ever‑shifting viral landscape.


